Graph TV
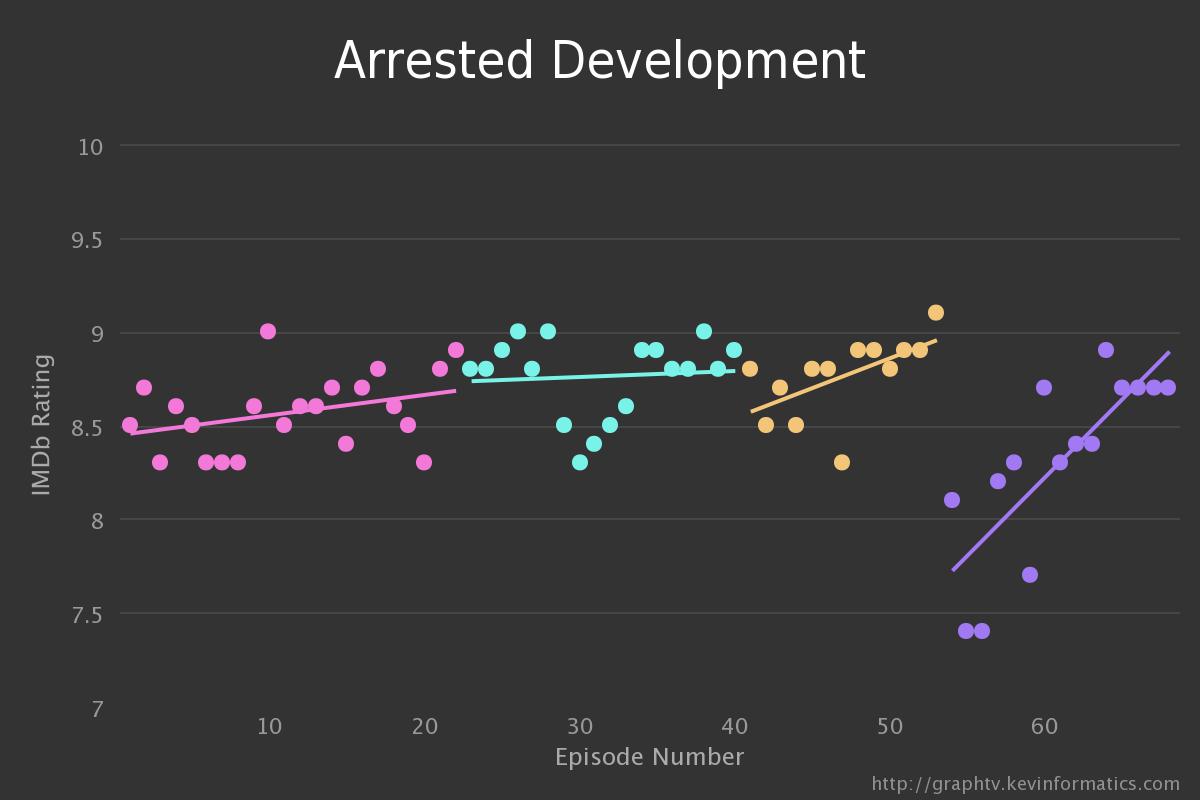
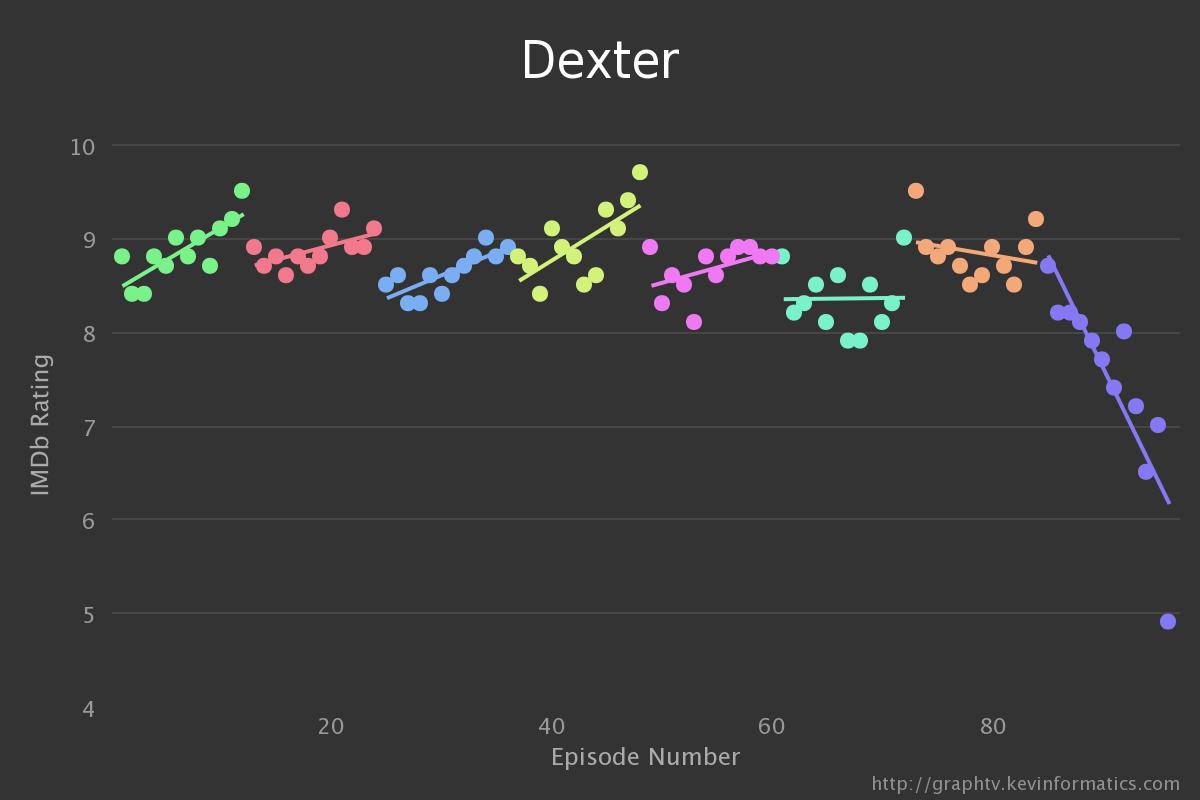
March 24, 2014 1:48 pmHere’s a pretty cool web tool called Graph TV that visualizes IMDB ratings of television show episodes. Each season is color-coded and individual dots (episodes) are linked to their IMDB page.
For example, people apparently didn’t like how Season 4 of Arrested Development started:
Or how Dexter ended:
Categorised in: Random Posts
This post was written by Neil


Comments are closed here.